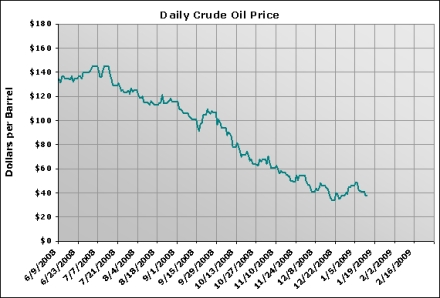
Daily price of Crude Oil June 2008 – Jan 2009
440
 crudeprice_011409
450 pixels
Daily Price of Crude Oil June 2008 – Jan 2009
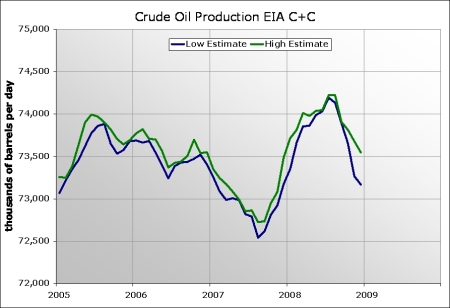
January 13, 2009Crude and Condensate Production
January 8, 2009Global Crude Oil Production 2003 – 2008
October 13, 2008Global Crude Oil Production 2003 – 2008
All Liquids Production in millions of barrels per day:
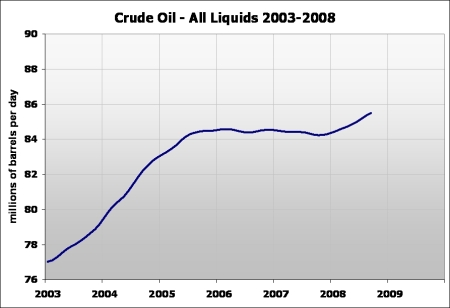
The first chart shows global production of all-liquids which includes Natural Gas Plant Liquids (NGPLs) has increased 2 mbpd more than conventional crude-and-condensate production. There are some notable decreases in production in the fourth quarter of 2008 which will cause C+C production to average about the same as 2005 and all-liquids production to avaerage about 1 mbpd above the 2005 level.
Matthew Simmons on Inventories
October 1, 2008This is a long passage from a Matthew Simmons paper released in November 2007.
Anothern Nail in the Coffin of the Case Against Peak Oil (2.87MB PDF)
Once these stop-gaps for filling the need for more petroleum are fully utilized, liquidating our vast pool of oil “stocks” or oil inventory is the only way demand growth can continue. The world’s petroleum stocks are immense as they need to provide for all of the oil flow between wellheads to a relatively small number of refineries around the world and then onto the vast wholesale and retail network of outlets that supply the final petroleum consumer with ready-to-use supply.
Since liquidation of oil stocks looms as a key new supply of petroleum, a brief primer about oil stocks might be useful.
Petroleum stocks are a mystery to most oil industry observers. The EIA’s Weekly Petroleum Stock Report now mesmerizes oil traders as if they were getting a glimpse into tomorrow’s racing form. But few oil experts have ever spent sufficient time grasping the complexities, the inherent inaccuracies and the useable limits embedded in the weekly reported “petroleum stock data.”
The EIA system of measuring oil stocks was hurriedly invented as an aftermath of the 1973 Oil Shock. In haste, the decision was made to sample a group of “primary” holders of crude oil, gasoline, distillate, jet fuel, etc. “Primary” was deemed to be any owner of a “vat of petroleum” greater than 50,000 barrels. Everything else was deemed “secondary” stocks (i.e., inventories at the wholesaler level) or “tertiary stocks” (i.e., the ultimate consumer). The theory behind the design of this data collection system was that primary inventories were “measurable”, while attempting to sample secondary, let alone tertiary stocks was essentially impossible. Thus, a decision was made to collect a sample of primary stocks and assume it represented a solid proxy for secondary and tertiary inventories, as well.
In order for the EIA to publish inventory stock reports, it asks a voluntary group of industry participants to report their weekly “primary” stocks. In theory, individuals around the country report, with seemingly remarkable precision, their measurement of “primary” oil stocks every Friday at 7:00 AM. This data is then summarized and electronically sent to the EIA over the ensuing couple of days. By the following Wednesday morning, the EIA’s sample is grossed up to represent not just the remainder of non-sampled primary stocks but the entire domestic supply of oil stocks. The Wednesday EIA stock data, as imprecise as it might be, remains the world’s only real-time report of “what is left to use” of the world’s most important natural resource, even though it is limited solely to the USA.
There has never been a government audit to see how many stock data reporters actually take a physical measurement. There is no penalty (or reward) for efficiently completing what one could argue is the world’s most important glimpse into our country’s fuel supply.
Most oil observers who glance through this detailed weekly U.S. oil inventory report then make the flawed assumption that it is a good proxy for global stocks, too. In fact, the quality of weekly oil stock data outside the USA is spotty and exceedingly erratic. Japan and Germany apparently have very high quality data collecting systems, but neither country has ever claimed to be better than the world’s “gold standard” – the EIA, and no other country in the world issues “high quality” weekly reports. There is no reliable stock data for any country outside the IEA member countries other than Singapore. Thus the stock accounting system is “hazy” at best.
What is most misleading about these weekly inventory reports is that there is no way to distinguish between the supply required to keep our immense oil system flowing and the remaining cushion of useable oil. When the EIA reports that our system has 310 million barrels of crude stocks, this includes every barrel of oil that has entered the USA by tanker. It also includes all the oil that leaves the North Slope of Alaska to slowly travel south to the West Coast refineries. All the crude in all our pipelines and the tank farms storing each segregated crude grade are part of this massive crude stock.
Finished product inventories are even more elusive. The USA now has about 170,000 individual gas stations spread throughout its 50 states. Each station has underground tank capacity of 2.0 to 3.0 days gasoline demand. The entire amount of semi-finished gasoline at our refineries and their blender components and all the pipelines, tanker trucks, rail cars and wholesale inventories are included in what are reported as “gasoline stocks.” (In actuality, all that gets reported are “primary” stocks contained in excess of 50,000 barrels, in similar fashion to the reported crude stocks.)
– Matthew Simmons
Natural Gas Update
July 30, 2008Goldman Sachs Group Inc. cut its U.S. natural gas price forecast for the Northern Hemisphere winter by 23 percent because of higher-than-expected output and lower demand from power plants.
Gas futures, which have fallen 42 percent since July 3, may trade at $10.30 per million British thermal units this winter, down from a July forecast of $13.40, analysts Samantha Dart and Jeffrey Currie said in a report dated Aug. 15. The U.S. investment bank reduced the average price estimate for September and October to $9.25 from $13.
“Higher U.S. production has led us to lower our price forecast,” the analysts said. “However, current U.S. natural gas prices are oversold as they stand below estimated marginal costs of production.”
Goldman lowered its average April-August 2009 gas price forecast to $9.10 per million Btu from $10.30 estimated earlier, the report said.
“Part of the softness in the U.S. natural gas balance may be explained by lower demand for power generation, likely due to weakness in U.S. economic activity,” the report said.
[update tomorrow – replace chart]
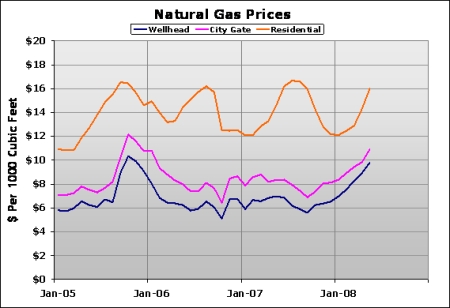
Bloomberg Nymex – as of July 31st, NG is at $9.25/1000 cubic feet – last year at this time it was about $6.20
Bloomberg City Gate Spot – $9.95/1000 cf
1000 cubic feet is approximately the same as 1million BTU (or ____)
retail prices seem to range about $4-$8 above the Nymex or City Gate Spot Price
Last year in September City Gate averaged $7.68 and residential $15.73
Let’s assume that City Gate will be $10-$12 this winter (although it could be higher). That would make residential at most 30% higher. But the price of gas is only a portion of a homeowner’s bill. A large percentage is delivery and other fees.
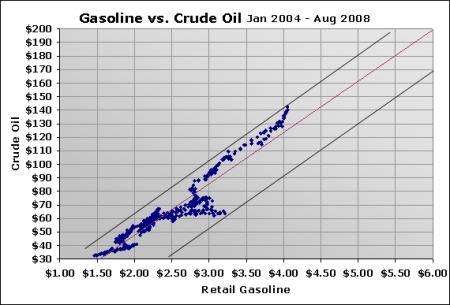
This requires more detailed analysis, but I don’t see NatGas home heating bills being more than 20% more expensive than last year. Wholesale natgas is definitely lagging the historical correlation with crude oil.
…
BOE conversion factor and units –
start setting up link in NG tab/Page


 Posted by JR